Cloud to Cloud Analysis with BuildIT Construction
 Objective:
Using BuildIT Construction to compare two point clouds taken at different times.
You’ll learn:
- A simple workflow for analyzing scans over time.
- Opening BuildIT, opening a BuildIT file and manipulating the viewport.
- Evaluating cloud deviation.
- Creating a report from the analysis.
Tutorial Download
If you would like to download the file used in this article, download the accompanying Training Data and extract its contents to a folder on your PC.
 Evaluate Cloud Deviation
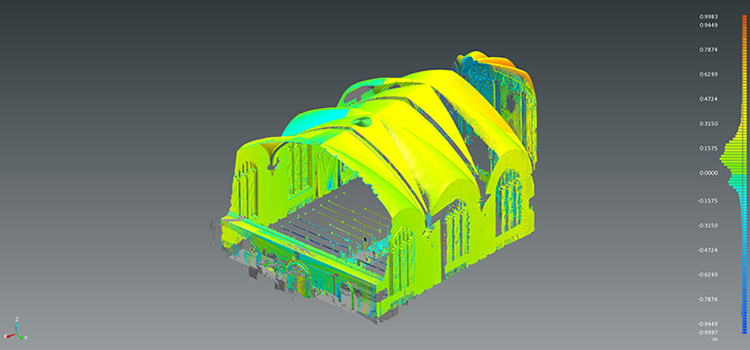
Now the cloud to cloud deviation will be performed. For this exercise, “Church_Scan_002” will be considered the reference and will be compared to “Church_Scan_001”.
- Select “Evaluate > Analysis > Cloud-to-Cloud Deviation Analysis”.

- Click anywhere on the “Church_Scan_002” cloud to add it to the Reference Clouds, next click on the Measurements box (box will turn yellow) and then click anywhere on the “Church_Scan_001” cloud (note that the deviation will be computed from the reference to the measurement).
- Set a Maximum search distance of 1 inch.
- For “Deviation computation”, this command will determine points pairs by selecting the nearest reference point in space to each measured point, and it will compute the difference from the reference point to the measured point. There are several options to analyze. For this exercise, select “Along local normal”.
- Full 3D
- Will measure the overall 3D difference for each pair of points. This can be useful in most cases, but if there is no overlapping data, the results could be skewed as the nearest point will not be close.
- Along local normal (Preferred Selection)
- Will measure the difference parallel to the normal of the reference point. This is a more accurate method of analysis for most point clouds that include normal in their reference cloud file.
- Along Specific Vector
- Define your own vector for analysis and it will measure the difference parallel to this vector only. This could be useful when only a deviation in Z or elevation is desired.
- Define your own vector for analysis and it will measure the difference parallel to this vector only. This could be useful when only a deviation in Z or elevation is desired.
- Full 3D
- For the “Color Scale”, use “Blue-Green-Red” to display results colored based on a high, within tolerance, and low approach. “Red-Green-Red” could also be used to color areas outside of tolerance as red.
- Check “Compute Limits”. This will allow the software to compute the tolerance limits for the coloring, which will be 1 inch based on the search distance.
- Select Apply.

- To view just the analyzed cloud, uncheck the Put in Show checkbox for the reference cloud “Church_Scan_002”.

Create a Report from the Analysis
Include the items created on a report.
- In the Manager Tab on the right of the screen, right click “Cloud-to-Cloud Deviation Analysis 1” and select “Add to Report”.
Note: If the manager panel is yellow, this indicates that a command is still active. Simply hit ESC or close the command to perform other functions. - Switch to the Report Tab and click the “Generate Report” button.

- When prompted specify a location and name for the PDF report.
- The BuildIT Report Writer will now launch and create the report.
Recap:
Congratulations, you have completed the Cloud to Cloud Analysis Module! By now you should have a grasp of how to:
- A simple workflow for analyzing scans over time.
- Opening BuildIT, opening a BuildIT file and manipulating the viewport
- Evaluating cloud deviation.
- Creating a report from the analysis.

