Wall Flatness - With CAD Data with BuildIT Construction
 Objective:
Using BuildIT Construction to measure wall flatness using scan and CAD data.
You’ll learn:
- A simple workflow for analyzing the scans verses a model.
- Opening BuildIT, opening a BuildIT file and manipulating the viewport
- Associating surfaces from the model to the point cloud.
- Performing surface analysis of the scan data verses the CAD data.
- Creating annotations of the analysis.
- Creating a report from the annotations and analysis.
Tutorial Download
If you would like to download the file used in this article, download the accompanying Training Data and extract its contents to a folder on your PC.
Activate the View of the Wall
Open the “Module 7.3.buildit” file by selecting “File> Open” and navigating to where the file is saved.
- Activate the “Wall to Analyze” view.
- Right click the view named “Wall to Analyze”.
- Select “Restore View”. You may also use the “First person view” to navigate to the area of interest.

 Associate Scan Data to CAD Surfaces
- Now the scan data should be associated to CAD surfaces. This allows the software to only perform analysis with scan points that are near CAD surfaces, speeding up the process.
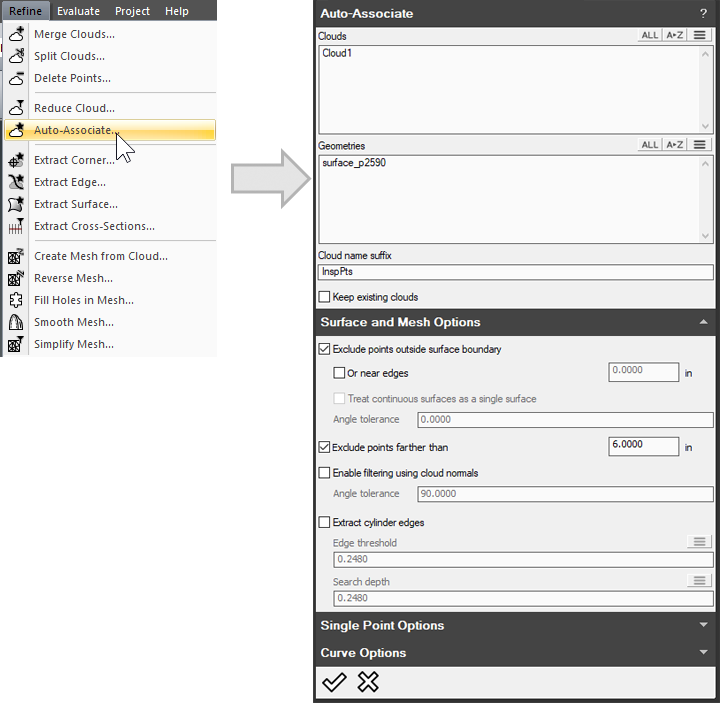
- Select “Refine > Auto Associate”.

- For “Clouds”, select the Cloud1 point cloud
- For Geometries, select the wall with the three doorways, "surface p2590".
- Ensure “Exclude points farther than” is checked with a value of 6 inches. This option will only search out up to 6 inches for points to associate. If the cloud is farther than 6 inches, it will be ignored.
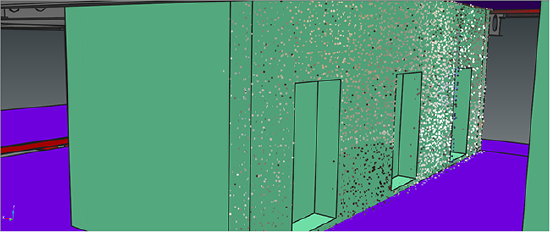
- Select “Apply”
 and view the result below:

- Select “Refine > Auto Associate”.
Perform Surface Analysis
- Now that the points have associated to our CAD, we can perform surface analysis.
- Select “Evaluate > Surface Deviation Analysis”.

- For “Surfaces”, select the wall with the three doorways, "surface p2590". This will pull all points associated to the surfaces.
- Set the “Maximum Search Distance” to 6 inches, mirroring the distance set in the Associate command.
- Select Preview
 to review the analysis.

- For “Color scale”, set it to Rainbow – Red-Green-Red. This will make points that are out of tolerance yellow to red and points that are within tolerance green.
- For “Analysis mode”, select “Colored cloud”.
- For the “Limits”, change to “User-defined”. The tolerance used for this exercise will be 1 inch. Enter 1 for “Upper tolerance” and -1 for “Lower tolerance”.
- Note: You can also use USIBD Lower or Higher Range for Color Scales.

- Note: You can also use USIBD Lower or Higher Range for Color Scales.
- Select “Apply”
 and view the result below:

- Select “Evaluate > Surface Deviation Analysis”.
Create Annotations
- Now, annotations are needed to represent the deviation we see between the scans and CAD.
- Select “Evaluate > Surface Inspection Annotation”.

- Select the Minimal annotation (3D only) radio button.
- Select a scan point to annotate, then select Apply
 to create the annotation, or middle mouse click.


- Repeat the previous step until several annotations have been created, use Set View
 to save a view with the annotations. Name it Deviation Analysis.

- Select “Evaluate > Surface Inspection Annotation”.
Create a Report from the Annotations and Analysis
- Include the items created on a report.
- Select items to include in the report.
- Include the two views created, the analysis, and the annotations.
- Right click and select “Add to Report”.
- If the items are not in the intended order, they can be moved up or down by selecting and dragging the item.

- Select Run
 to create the report.

- Select items to include in the report.
Recap:
Congratulations, you have completed the module on measuring wall flatness with CAD data! By now you should have a grasp of how to:
- A simple workflow for analyzing the scans verses a model.
- Opening BuildIT, opening a BuildIT file and manipulating the viewport
- Associating surfaces from the model to the point cloud.
- Performing surface analysis of the scan data verses the CAD data.
- Creating annotations of the analysis.
- Creating a report from the annotations and analysis.

